Personal Projects
1 kHz Sallen-Key Low-Pass Filter
I designed and simulated a second-order, unity-gain Sallen-Key low-pass filter using LTspice. The goal was to place the cutoff frequency at 1 kHz and verify the result using an AC sweep and an automated measurement.
Why I built it
I wanted practice turning a target frequency response into component values, and then verifying that the circuit behaves the way the calculation predicts.
Circuit design
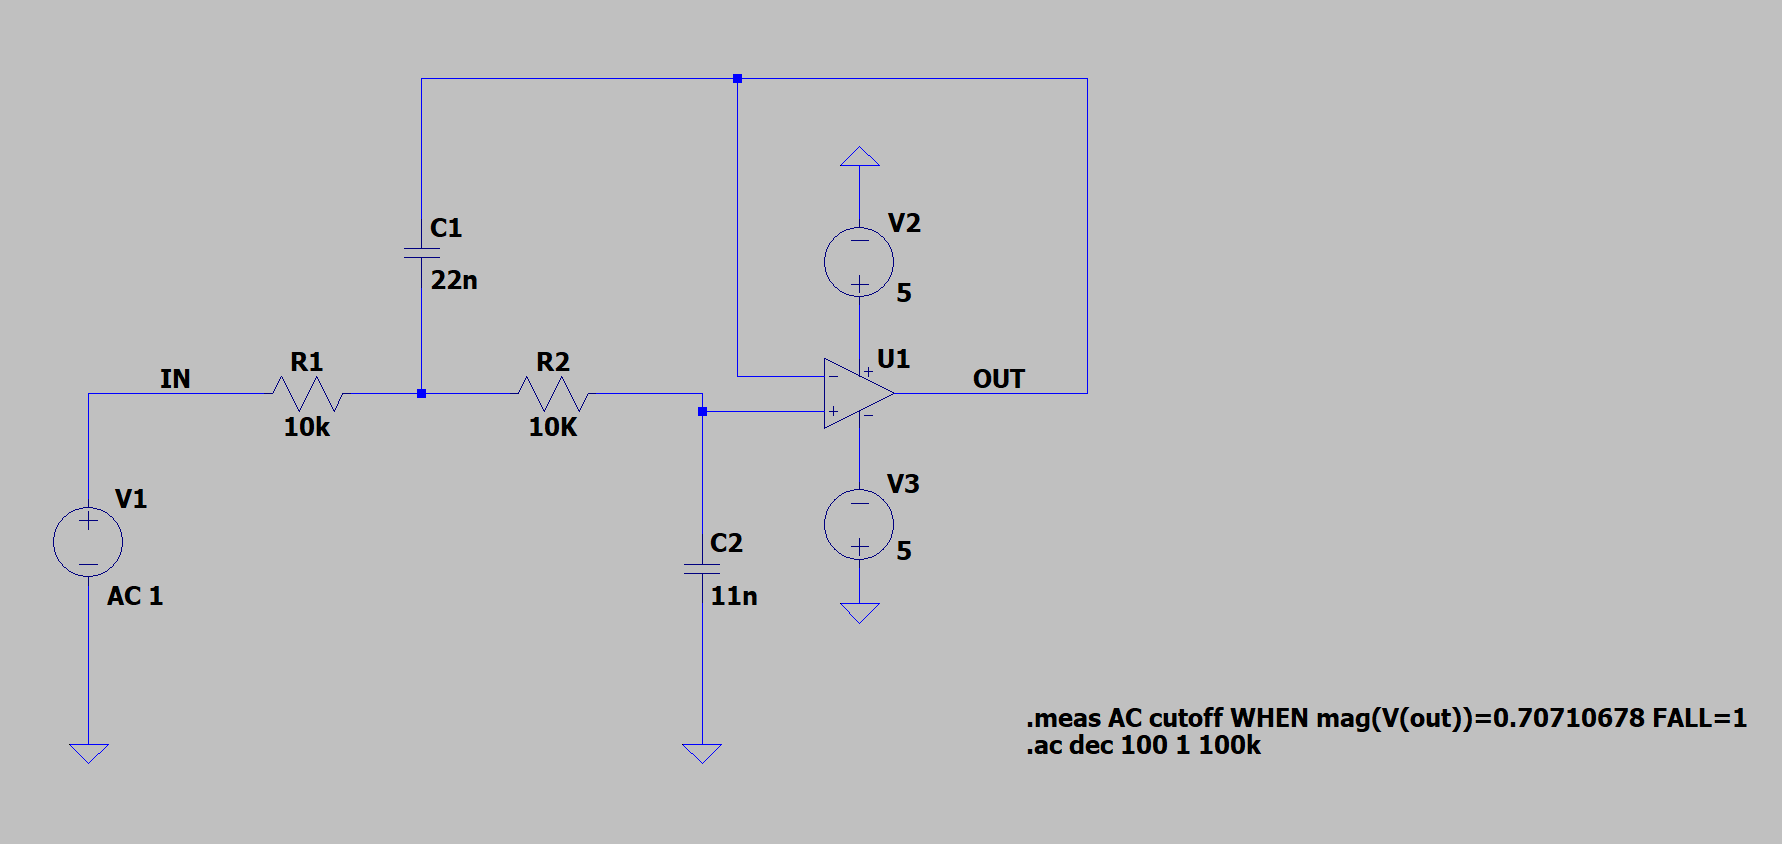
Figure 1. LTspice schematic of the Sallen-Key low-pass filter. The component values and op-amp supply connections are shown.
The math
For the values, I used R1 = R2 = 10kΩ, C1 = 22nF, and C2 = 11nF. With these values, the calculated cutoff frequency is about 1.02 kHz.
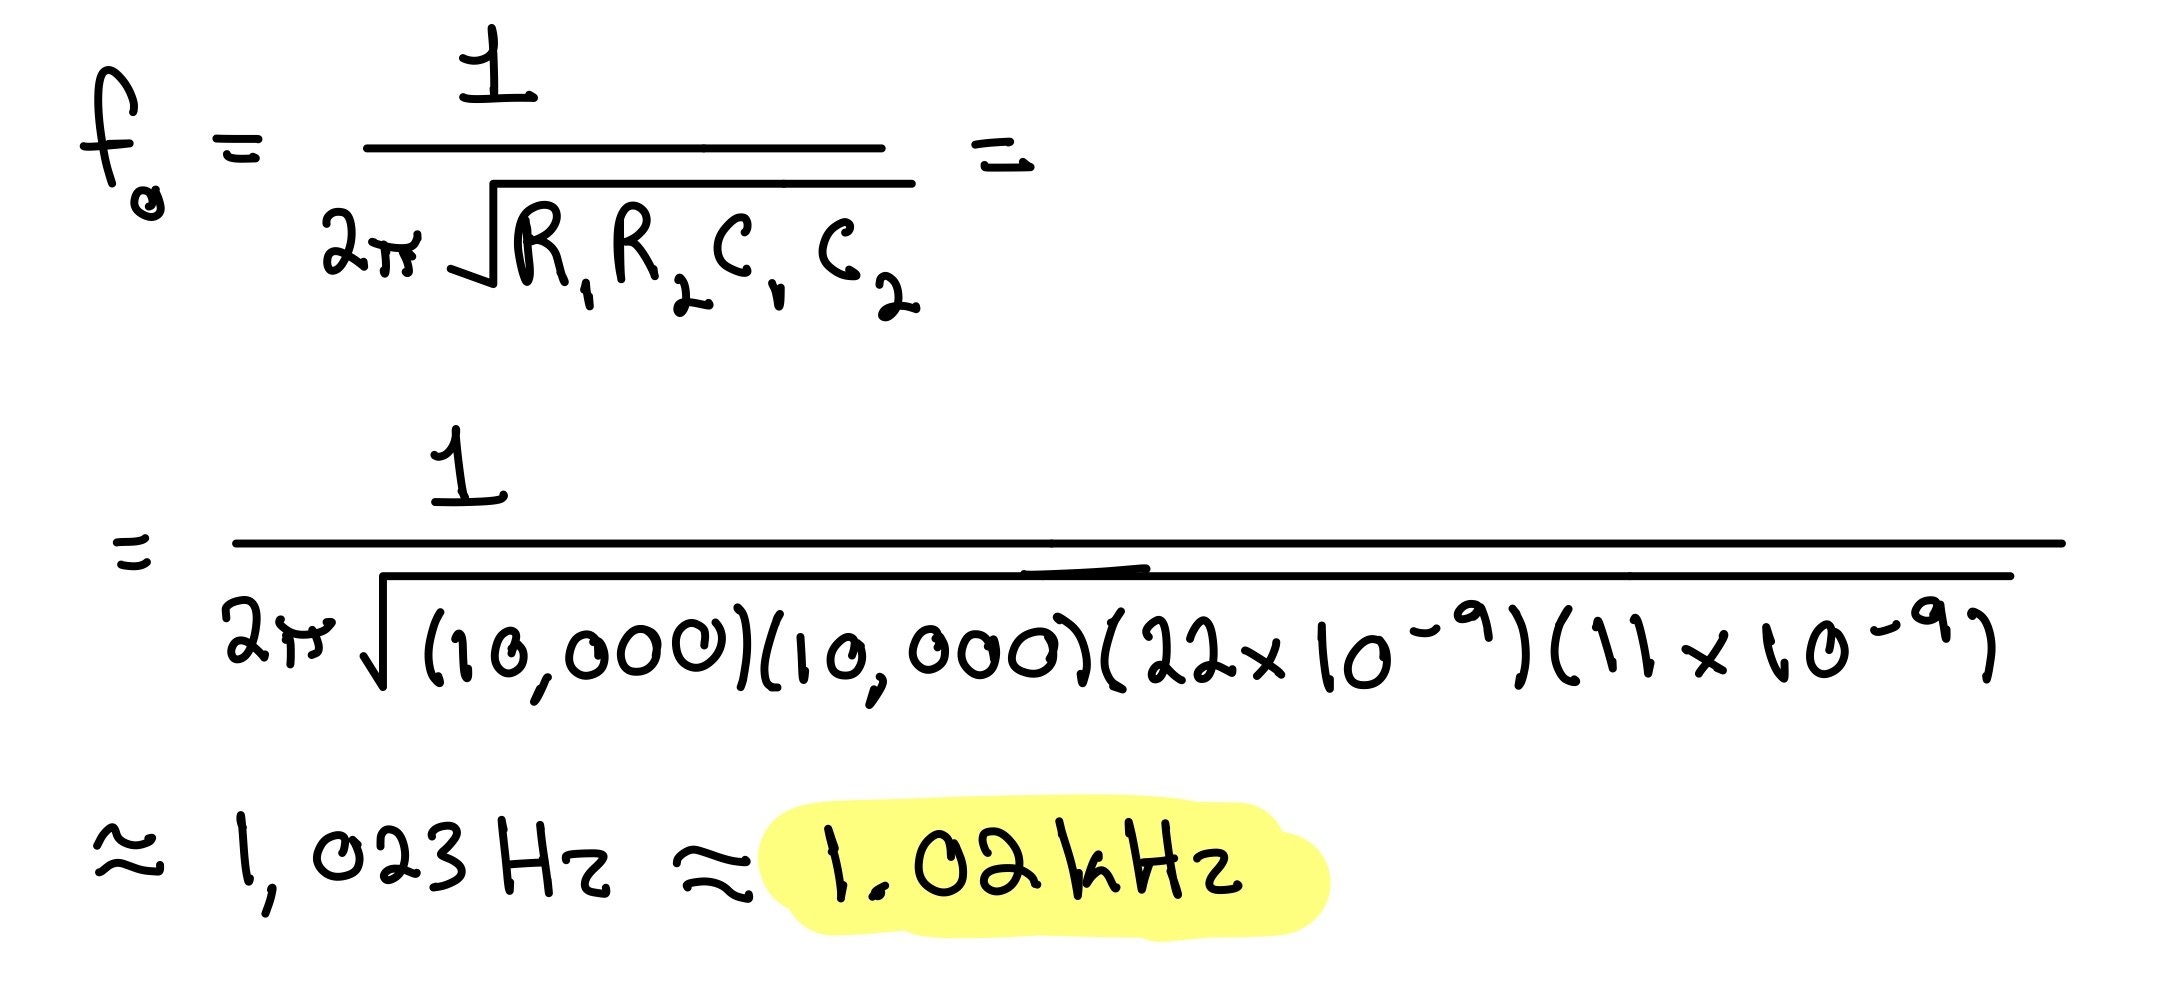
Figure 2. Hand calculation of the filter’s expected frequency using the selected resistor and capacitor values, giving approximately 1.02kHz.
Verification
I ran an AC sweep in LTspice to see how the filter responds as the input frequency increases. The full-range plot shows that the output stays relatively steady at low frequencies, then decreases at higher frequencies. This is the expected behavior of a low-pass filter.
I then zoomed in around the transition near 1 kHz. This view makes it easier to inspect where the output begins to fall toward the cutoff level, but the graph alone is not the most precise way to report the cutoff frequency.
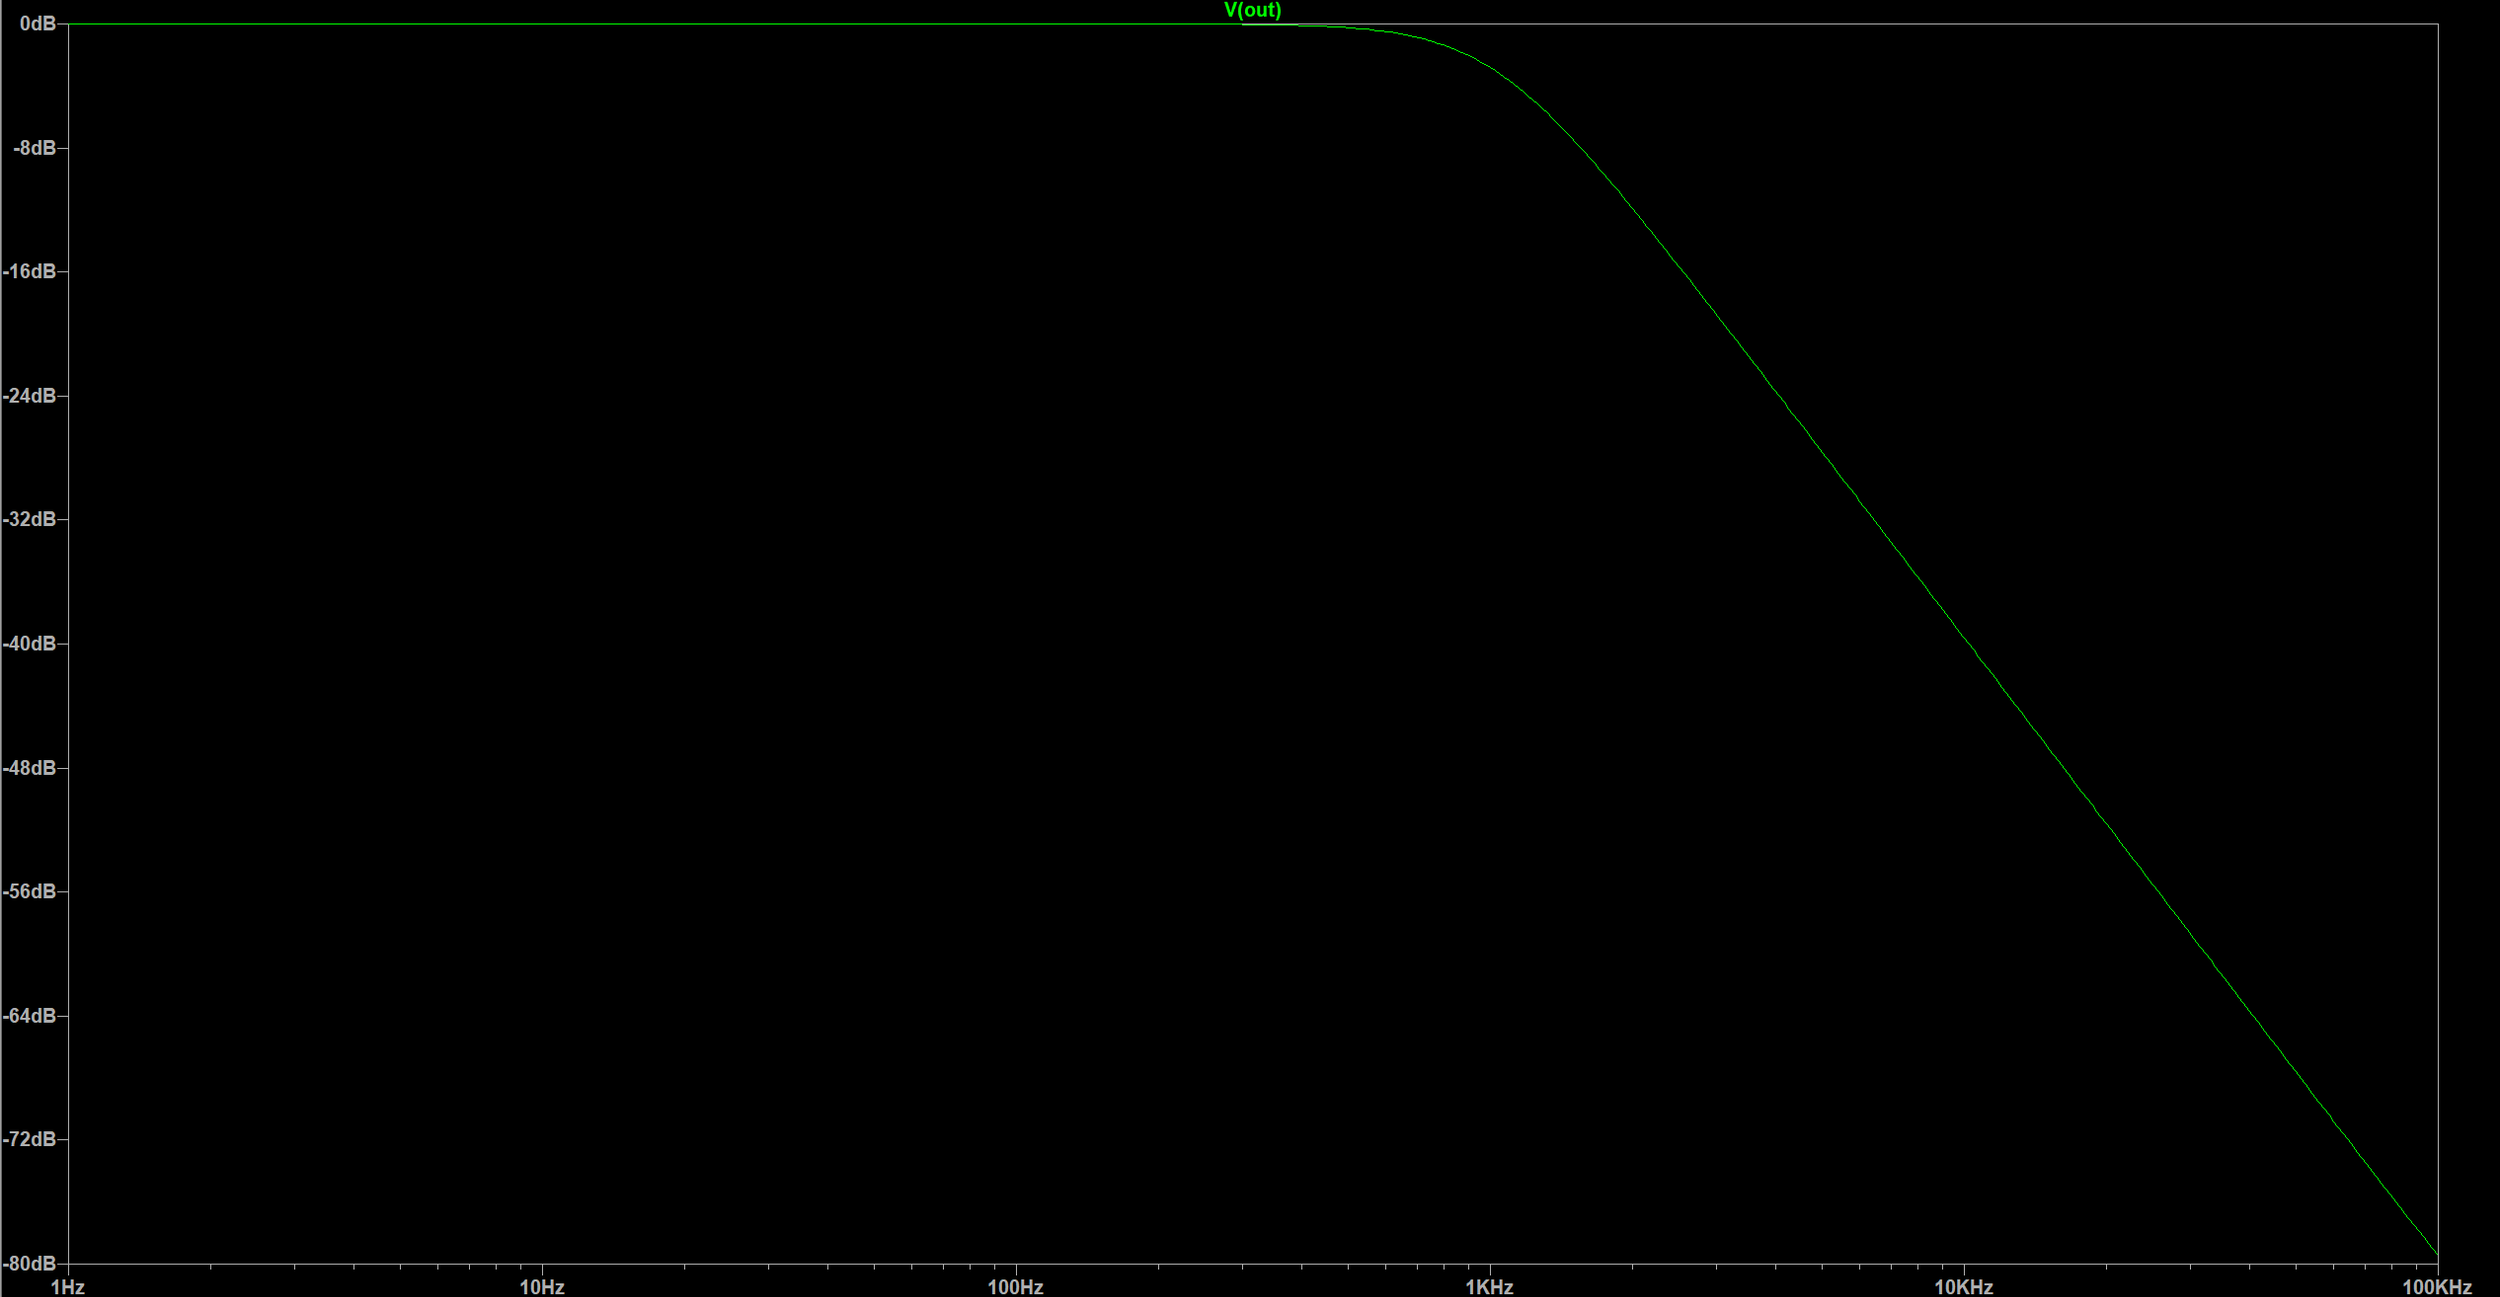
Figure 3. Full frequency response. The output is relatively flat at low frequencies and falls as frequency increases.
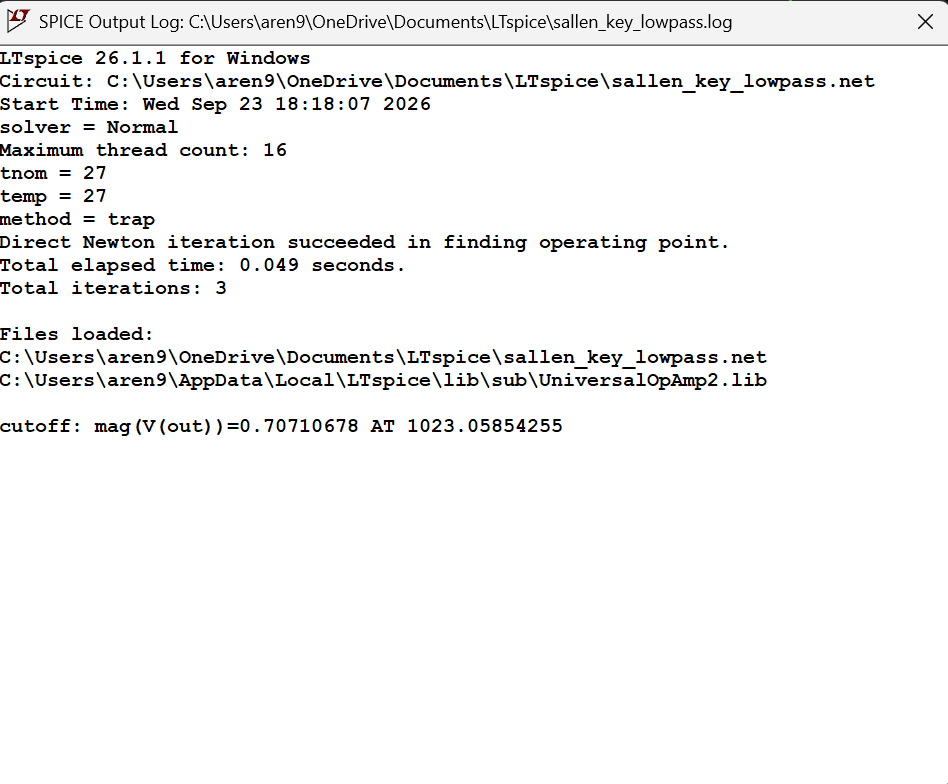
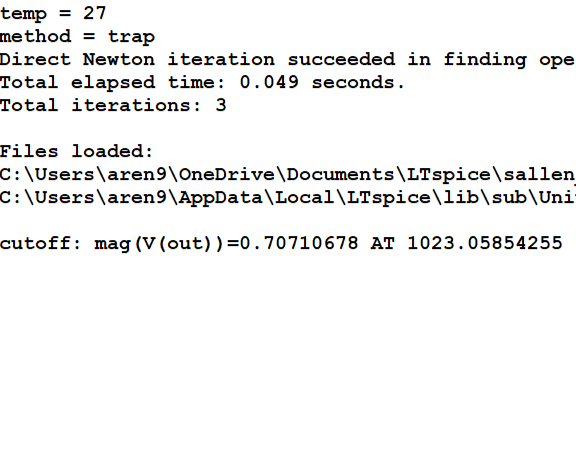
Figure 5. LTspice output log showing mag(V(out)) = 0.70710678 at 1,023.06 Hz.
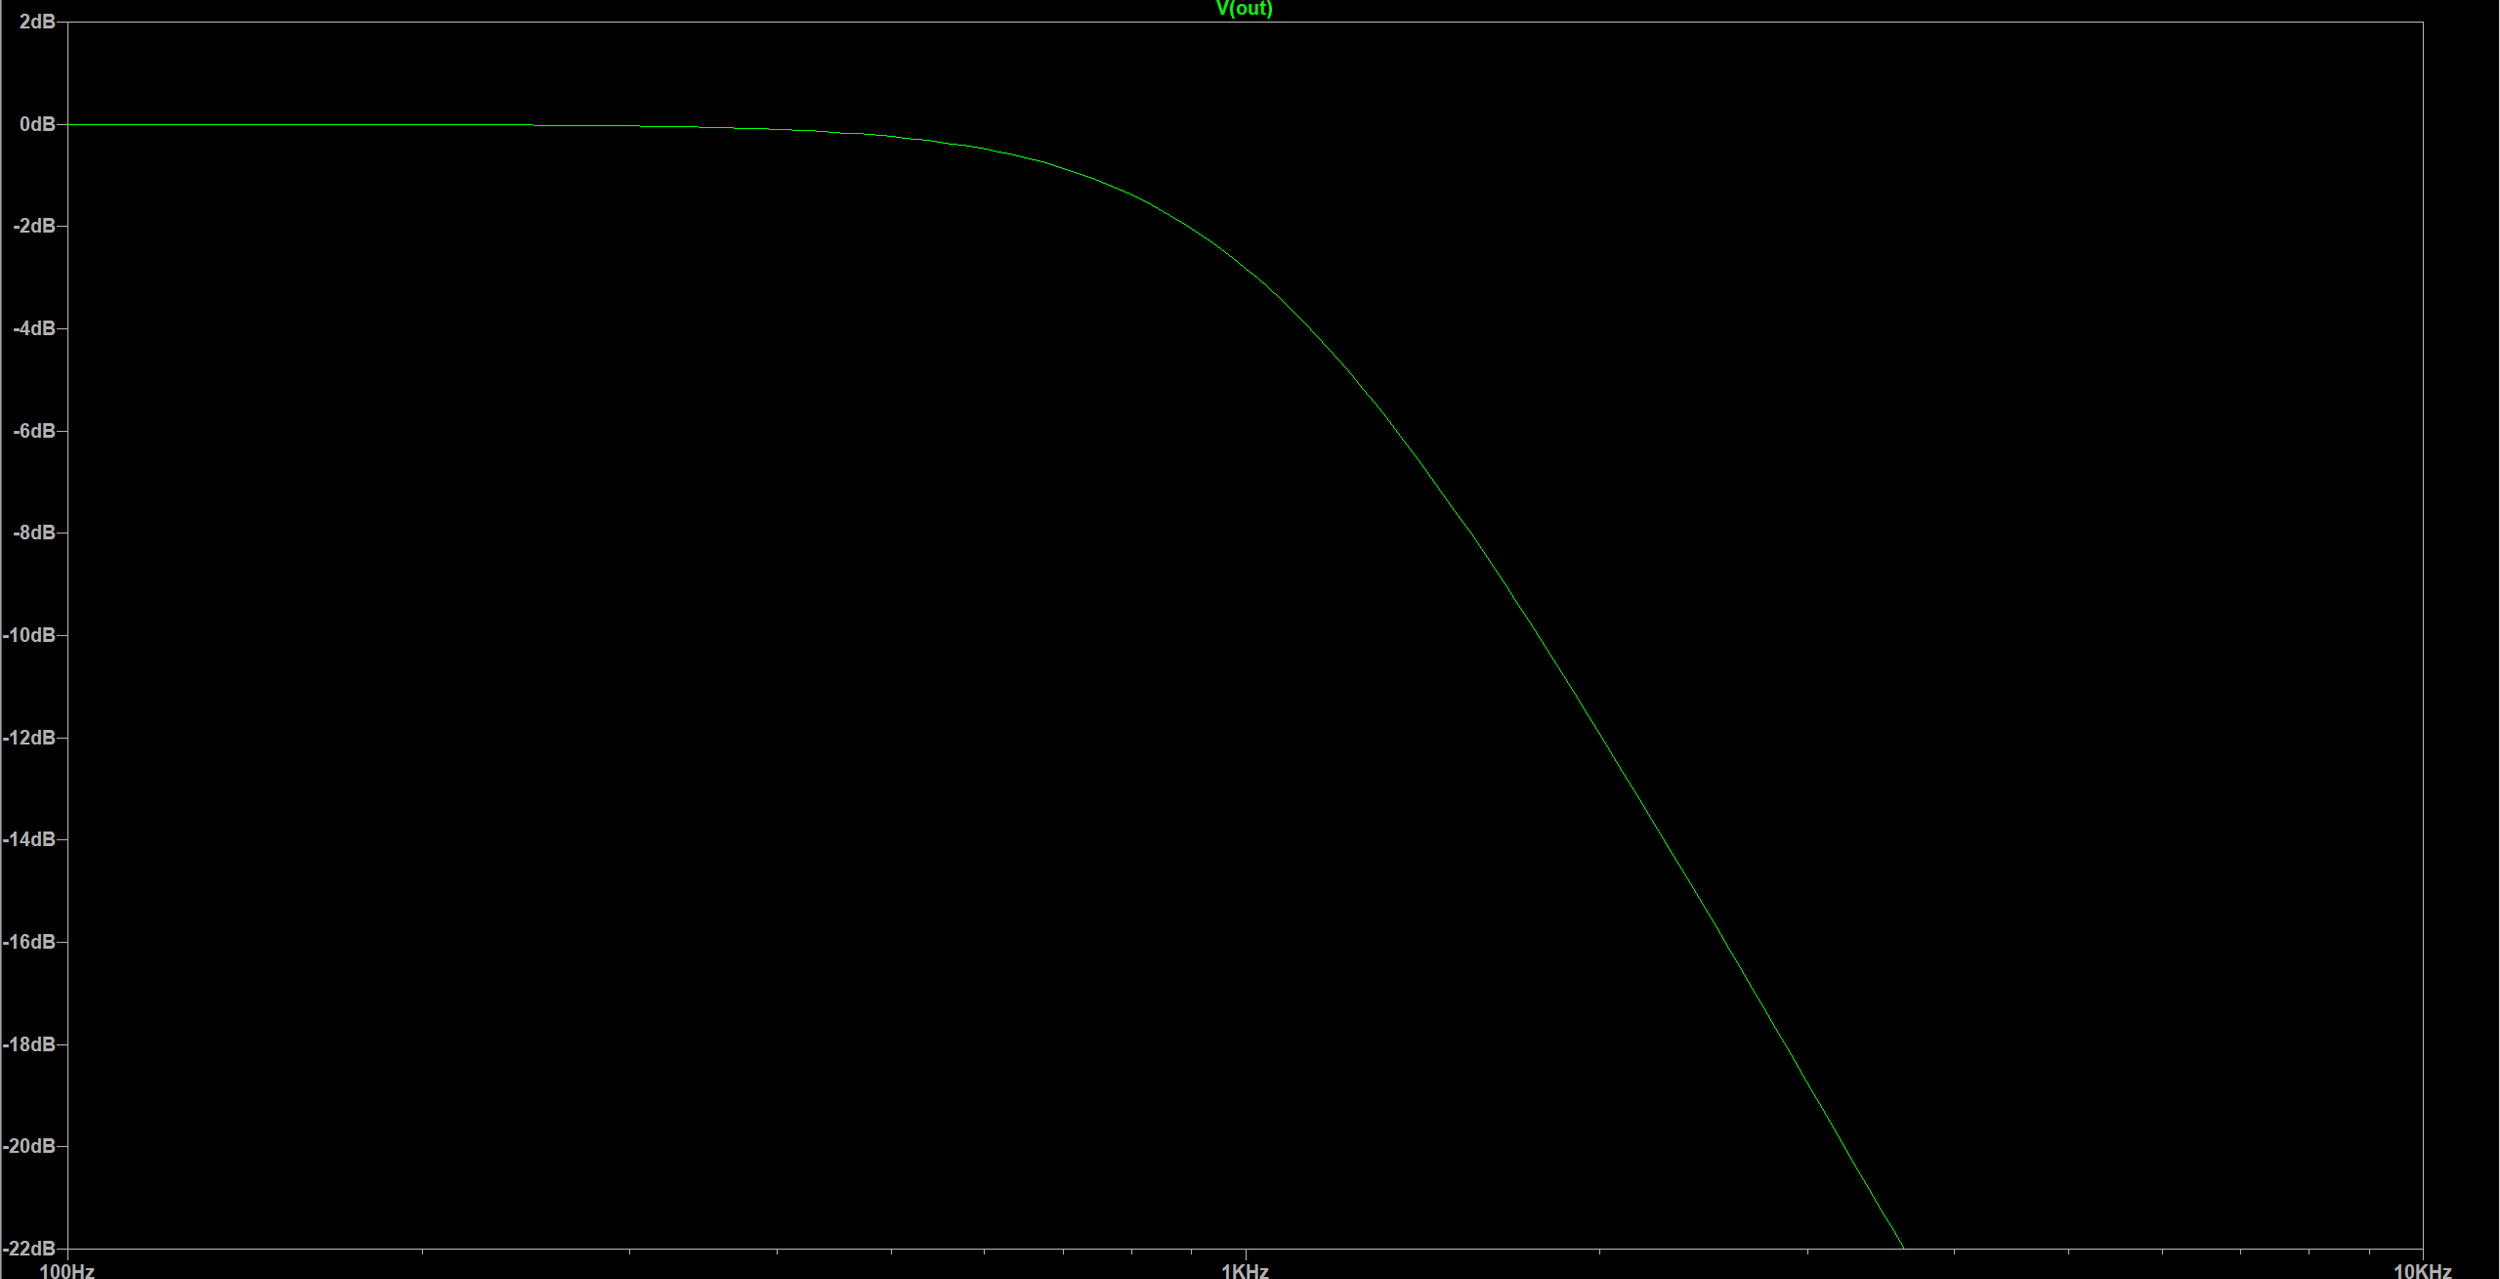
Figure 4. Close-up of the response near the cutoff, making the approximately −3 dB region easier to inspect.
Cutoff-frequency measurement
To measure the cutoff accurately, I used an LTspice .meas command to find the frequency where the output magnitude reached 0.70710678. That is approximately 70.7% of the passband amplitude, the usual −3.01 dB cutoff point. LTspice reported 1,023.06 Hz (1.023 kHz), which is close to my hand-calculated value of 1.02 kHz and the 1 kHz design target.
What I learned
How to choose component values from a target cutoff frequency.
How to draw a circuit in LTspice, run an AC sweep, and read the frequency response.
How to use a .meas command to get exact results instead of estimating from a graph.
How comparing simulation against hand calculations confirms a design.